|
 |
 |
 |
 |
 |
 |
Focusing With Spectral Entropy |
Proper camera focus has a profound effect on image quality and therefore plays an important role in many computer vision applications. This page presents one solution to the problem of measuring how much a given image is out-of-focus based on spectral method. For detailed description, please see the online paper "A Bayes-Spectral-Entropy-Based Measure of Camera Focus Using a Discrete Cosine Transform" published at Pattern Recognition Letters and the Matlab demo. |
||||||||||||
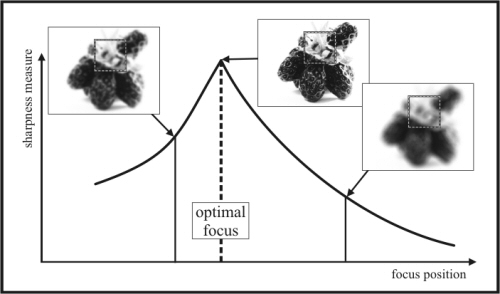
Passive camera focusing : Passive methods of camera focusing are based on analyzing an image of the object being focused. The object is focused by adjusting the lens of the camera with respect to maximizing some measure of the image focus. This measure is usually calculated within a small portion of the image (i.e., the focusing window). A sketch of the values such a measure might take at different distances from the optimal focus is shown below.
Figure 1: The graph illustrates the values of focus measure (sharpness) with respect to different positions of the lens. The strawberry images illustrate the extent of (de)focus.
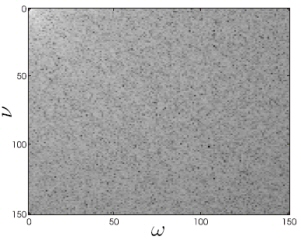
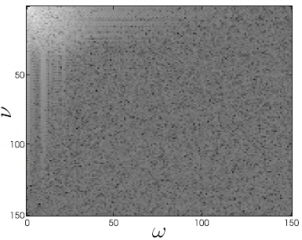
Our approach in a nutshell : We present here a novel measure of focus based on estimating the uniformity of the image spectrum. We assume that when a typical image is out of focus its amplitude spectrum is less uniform than when it is focused. To assess this uniformity we made use of the Bayes entropy. The image is transformed to its spectral representation via an 8X8 discrete cosine transform (8X8 DCT). The Matlab source code and a demonstration can be downloaded here. Normalized DCT: The normalized DCT (nDCT) of an image is obtained by calculating the image spectrum via DCT, taking the absolute value of the spectrum and dividing it with its sum. This means that all components of the spectrum sum to one. The nDCT spectrums of two strawberry images are shown below.
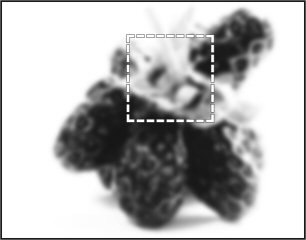
Figure 2: The upper row shows a focused image (a) and its nDCT spectrum (b), while in the bottom row, a defocused image (c) and its nDCT spectrum (d) are shown. The gray levels in the spectrum images (b,d) correspond to the amplitudes of spatial frequencies-- white means high amplitude. For better visualization, the logs of spectrum are shown here. Spectral entropy : From the images in Fig.2 we observe, that when an image is out of focus (Fig.2c), there is a pronounced mode located at lower frequencies of its nDCT (Fig.2d), while in the case of focused image (Fig.2a), the spectrum is more uniform (Fig.2b). We assume, that the uniformity of the spectrum reflects how much the image is focused. To quantify the level of uniformity we calculate the Bayes-entropy-measure of the nDCT image. To make the measure more robust to noise, the entropy is calculated only over spectral components whose order is lower than some predefined value-- i.e., we ignore the high frequencies.
The proposed measure of focus: Given a focusing window, the measure of focus is calculated as follows:
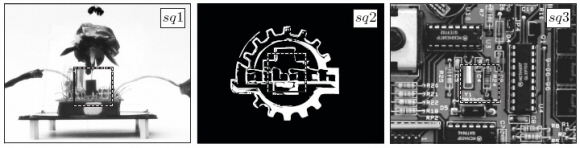
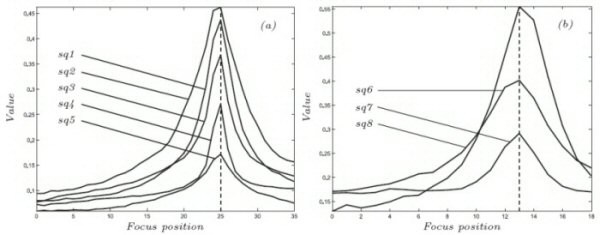
Some results : Several objects/pictures (Fig.3) were placed in front of the visible-light and thermal camera and for each image a sequence of differently focused images was recorded. The proposed measure was calculated for each image in the sequence. Some results are shown in Fig.4. Note, that since the nDCT is contrast invariant, the proposed measure is contrast invariant as well. As seen in Fig.4 the measure behaves well even far away from the optimal focus, thus allowing for the use of optimization to find the optimal focus (in contrast to greedy search). Additional tests with noise have shown that the measure performs well even in presence of severe noise and outperforms several well-known measures. For more results and details as well as further discussion, please see the on-line paper.
Figure 3: Images/objects used in experiments with visible-light camera (upper, middle) and object used in experiments with thermal camera (bottom). The dashed rectangles depict the area where the focus measure was calculated (the focusing window).
Figure 4: The graphs show the responses of the focus measure to different levels of defocus for each sequence of the images from Fig.3. The left image shows responses in experiments with visible-light camera, while the right image shows responses in experiments with thermal camera. The vertical dashed line in the images denote the optimal focus position. Publication: M. Kristan, J. Pers, M. Perse, S. Kovačič. "A Bayes-Spectral-Entropy-Based Measure of Camera Focus Using a Discrete Cosine Transform". Pattern Recognition Letters, 27(13): 1419-1580, October 2006.Page last updated 12.3.2007 by Matej Kristan |