|
|

|
 |
Muscle Fibre Image Segmentation
|
Automated Segmentation of Muscle Fibre Images Using Active Contour Models
The cross-sectional area of different fiber types is an important anatomic feature in studying the structure and
function of healthy and diseased human skeletal muscles. Such studies are however hampered by the thousands of
fibers involved when manual segmentation has to be employed. We have developed a semi-automatic segmentation
method, which utilizes computational geometry and recent computer vision techniques to significantly reduce the
time required to accurately segment the fibers in a sample. The segmentation is achieved with only the effort of
pointing to the approximate centroid of each fiber. The set of centroids is then used to construct the Voronoi
polygons, which correspond to individual fibers. Each Voronoi polygon represents the initial shape of one active
contour model, a so-called snake. In the energy minimization process, which is executed in several stages, different
external forces and problem specific knowledge are used to guide the snakes to converge to fiber boundaries. The
results show that this approach for segmenting muscle fiber images is fast, accurate, and reproducible when
compared to manual segmentation performed by experts.
The following images show the steps of the procedure. The first image shows the original muscle fiber image (1).
On that image the centroids of muscle fibers are manually defined(2). Based on these centroids the Voronoi
diagram is build (3) and each polygon is turned into one active contour model. Several steps using different
external forces are used (4,5,6) to gradually lead the snakes to their desired position.
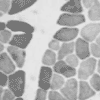
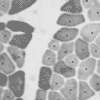
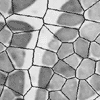
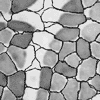
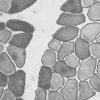
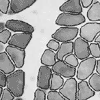
Figure 1: Semi-automatic procedure steps
The semi-automatic procedure was applied to six muscle fiber images with over 100 muscle fibers. The results
are shown on the following images.
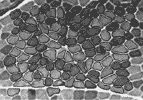
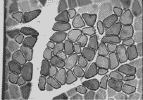
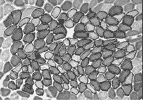
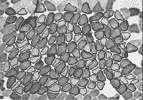
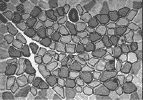
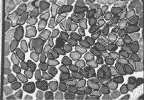
Figure 2: Examples of segmented muscle fiber images
Each image was segmented four times, based on four different sets of centroids. The same muscle fibers were also
manually segmented. The diagrams show four contours of percent error of semi-automatic segmentation, which
overlap well, showing the stability of the procedure. The gray contour shows the error of the manual
segmentation.
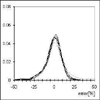
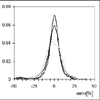
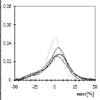
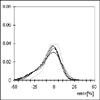
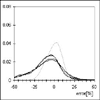
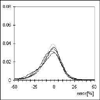
Figure 2: Error diagrams
Publication:
A. Klemenčič, S. Kovačič, F. Pernuš: "Automated Segmentation of Muscle Fiber Images Using Active Contour
Models", Cytometry, 32(4), 317-326, August 1998.
|
|
|


