 |
 |
 |
 |
 |
 |
 |
Trajectory-Based Analysis of Team Sports
|
Performance evaluation
The main purpose of activity recognition is to give the players and their coaches an objective feedback about players' performance during the actual match. We have developed a method which allows the coaches to obtain such feedback from player trajectories. |
| We use activity templates to build an advance probabilistic model (Bayesian network) that encodes the temporal and logical relations between the bey elements of an activity. The model is build by observing tree different temporal relations (before, within and simultaneously) between moves and screens of different players. |
| Building the Bayesian network from activity template |
The activity template already contains all the information needed to construct the network. It specifies the number and type of elements and their temporal profile (Figure 1). This temporal profile can be automatically transformed into the temporal relations using some heuristic rules.
Figure 1: Activity template and timeline for a simple "Double screen" activity. In order to be able to define the temporal relations between elements, we generate synthetic trajectories using the spatio-temporal information from the template and apply the element detectors to those trajectories. This way we obtain the timeline that defines the actual time intervals in which the elements occur. It should be noted that the screen element, as it is defined in the template, is divided into the move of the player that is making the screen to the screen position and the actual screen element (e.g. elements pl 4 move and afterwards pl 4 screen for pl 5 in Figure 2. By observing the starting and ending times of the element intervals, we can define whether the element has to be executed before, within or simultaneously according to other elements from the activity. It is important, that we retain only the relations to those elements that happen immediately before the element that is currently analyzed. This approach does not guarantee the optimal definition of temporal relations, since it may happen that some additional relations between elements which are not contextually dependent are observed (e.g. pl 4 screen for pl 5 and pl 3 move in Figure 2). However, such temporal relations should be observed anyway whenever the activity is executed correctly and thus should not influence considerably the final activity evaluation. |
 |
Figure 2: Timeline observed from simulation of activity template in Figure 1 and observed temporal relations. |
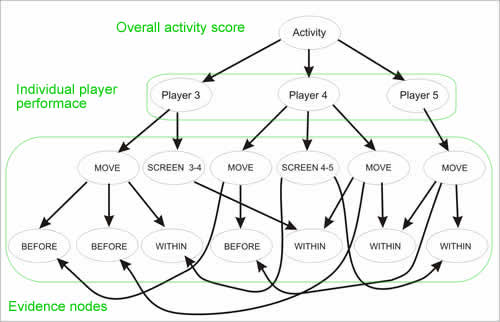
| The Bayesian network is divided into four contextual levels (Figure 3): |
The probabilities of nodes on the first and the second level can not be observed directly from the trajectories and therefore depend on the evidence from nodes on levels three and four and are given as posterior probabilities $P(A_i=true|e)$. The higher the posterior probability the greater the chance that the activity was performed flawlessly. |
 |
Figure 3: Bayesian network for the "Double screen" example. |
| Experimental results: |
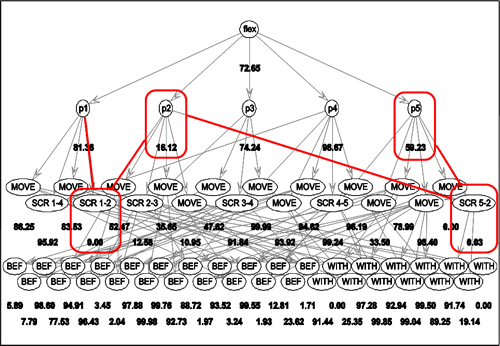
Based on the results of testing on 63 real trajectory segments that vary significantly in time and space, we can conclude that Bayesian network which is obtained from the activity template can be used to evaluate the overall performed of the team as well as the the performance of individual players. Additionally, the insight into the graphical structure of the Bayesian network is helpful in further analysis the overall performance, i.e. when we want to determine why a particular activity was performed poorly. This can help the basketball experts to discover and eliminate the causes for poor performance, thus giving the team an additional insight into their game. Fgure 4 shows an example of result for poorly executed "Flex" offense which received only 72,85 % out of possible 100%. By analyzing into detail the number in the network, we can determine that the reason for poor execution lies in the poor performance of player 2 who failed to perform two screens; a screen with player 1 and another screen with player 5. |
 |
Figure 4: An example of a Bayesian network for a "Flex" offense. Numbers below the nodes show how well each element was performed. Red squares show the reasons for poor execution of the offense (player 2 faild to perform a screen with player 1 and anoter screen with player 5). |
| In the movie below you can see an on-line evaluation of a well executed "Flex" offense. |

